Brief Processes:

|
1. Run bolus infusion experiments to estimate pulmonary capillary distribution
2. Fit the bolus infusion model to the lung bolus infusion experimental data and hence quantify the pulmonary capillary distribution |

|
3. Run quinone perfusion experiments to estimate the concentrations of quinone and reduced quinone in pulmonary venous effluent under steady state.
4. Run quinone perfusion experiments with inhibitors to identify the roles of redox enzymes in quinone metabolism. 5. With the combination of capillary distribution, fit the perfusion model to lung perfusion experimental data with proper assumptions, and hence quantify the activities of lung redox enzymes. |

An Application:
Differential Responses of Targeted Lung Redox Enzymes
to Rat Exposure to 60% or 85% Oxygen
Background:
Though prolonged hyperoxic exposure causes lung toxicity in rat lungs, rats exposed to hyperoxia such as 85% oxygen (O2) for a prolonged time induced a tolerance to lethal hyperoxia such as 100% O2, which was suggesting by an increased survival in 100% O2 of these pre-exposed rats. It is interesting that rats exposed to 60% O2 for a prolonged time didn't increase but decreased the survival rate in 100% O2. These differential effects suggest there were re-balances of O2-related metabolisms when rats exposed to hyperoxia and these re-balances were sensitive and delicate. A quantitative evaluation of changes on related redox enzymes will help us understand the re-balance developed by hyperoxic exposure, in other words, the hyperoxia-tolerance and susceptibility.
Previous studies in Dr. Said Audi's lab demonstrated that ubiquinone compounds could be good probes to estimate pro- or anti-oxidant enzymes such as NQO1, mitochondrial complex III. For example, it is demonstrated that DQ (duroquinone) is reduced into DQH2 (hydroquinone) dominantly by cellular enzyme NQO1, which is an important anti-oxidant , and DQH2 can be oxidized by mitochondrial complex III which is an important source of reactive oxidative species (Audi 2005, Audi 2008). Ubiquinone compounds are membrane permeable, so, they can easily cross through cell membrane. Thus, we can evaluate the activities of complex III, NQO1 in intact lungs by the changes on DQ/DQH2 concentration in DQ/DQH2 perfusate before and after the perfusate passage through the lungs. The selection of intact lungs keeps the lung structure, the essential cellular enzymatic environment and keeps all cells in-situ, hence allows us to analyze the changes due to hyperoxic exposure in a more systemic way. The experimental data can be analyzed quantitatively by combined mathematical models. The brief processes was described in the above section. The detailed models are described in 'Models' section.

Experimental Results:
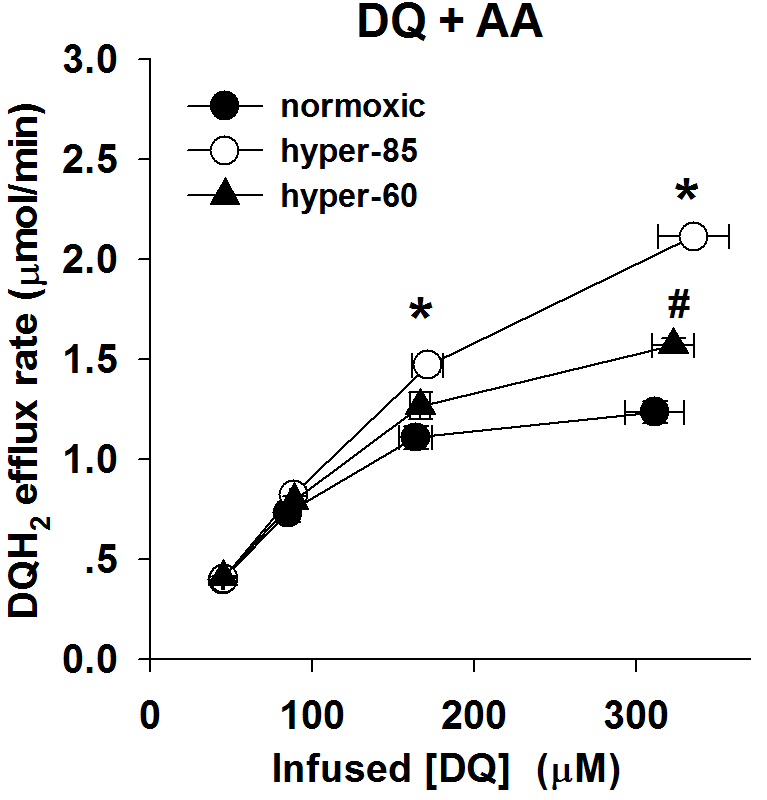
As described in 'Experiments' section, rat lungs were isolated and attached to a perfusion-ventilation system. Perfusate containing DQ or DQH2 with/without inhibitors were infused into lungs following the designed protocols. The DQ/DQH2 concentrations in venous effluent were measured and plotted in figure below. The x-axis presents the total probe concentration (oxidized and reduced form) in venous effluent, which is the concentration of free probe in perfusate. The y-axis presents the efflux rate of corresponding reduced/oxidized product in venous effluent. 'Normoxia' stands for the lungs from rats exposed to room air. 'hyper-85' stands for the lungs from rats exposed to 85% O2 for 7 days and 'hyper-60' stands for the lungs from rats exposed to 60% O2 for 7 days.
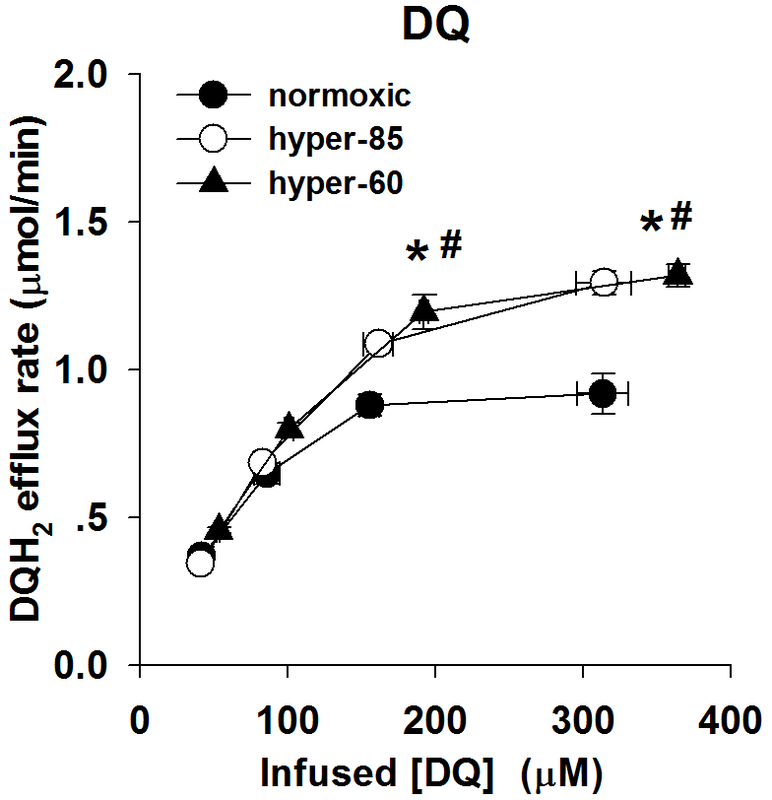
Figure 2.
As described in 'Experiments' section, rat lungs were isolated and attached to a perfusion-ventilation system. Perfusate containing DQ or DQH2 with/without inhibitors were infused into lungs following the designed protocols. The DQ/DQH2 concentrations in venous effluent were measured and plotted in figure below. The x-axis presents the total probe concentration (oxidized and reduced form) in venous effluent, which is the concentration of free probe in perfusate. The y-axis presents the efflux rate of corresponding reduced/oxidized product in venous effluent. 'Normoxia' stands for the lungs from rats exposed to room air. 'hyper-85' stands for the lungs from rats exposed to 85% O2 for 7 days and 'hyper-60' stands for the lungs from rats exposed to 60% O2 for 7 days.
Figure 2.
|
|
|
Figures from the left to the right
Figure 2A: The relationship between the steady state rate of DQH2 efflux and the infused DQ concentrations during DQ arterial infusion, for normoxic lungs (n = 4), hyper-85 lungs (n = 5) and hyper-60 lungs ( n=5)
Figure 2B: The relationship between the steady state rate of DQH2 efflux and the infused DQ concentrations during DQ arterial infusion in the presence of AA (10 uM), for normoxic lungs (n = 5), hyper-85 lungs (n = 5) and hyper-60 lungs (n=4).
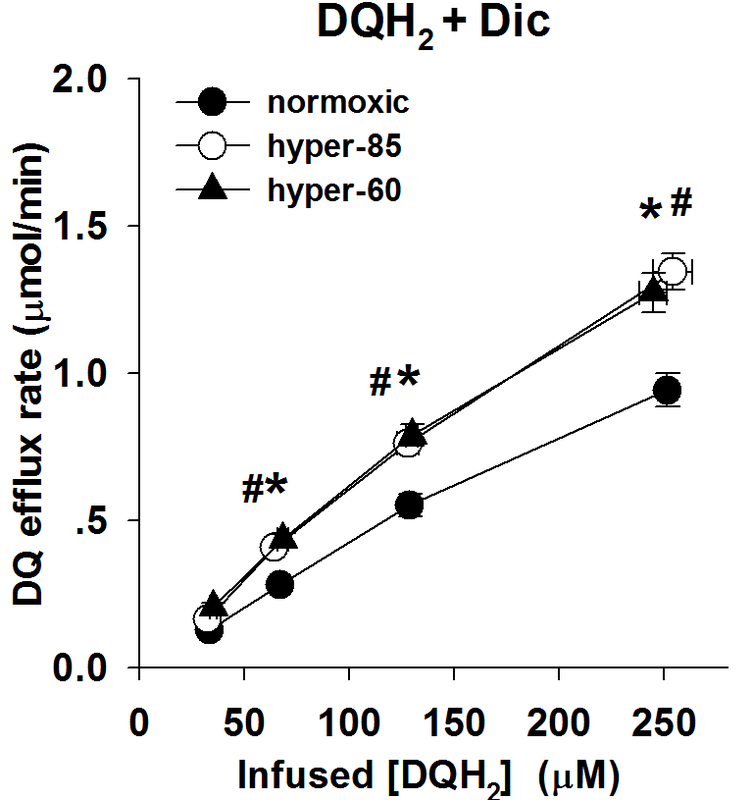
Figure 2C: The relationship between the steady state rate of DQ efflux and the infused DQH2 concentrations during DQH2 arterial infusion in the presence of Dic (400 uM), for normoxic lungs (n = 6), hyper-85 lungs (n = 6) and hyper-60 lungs (n=5).
Values are mean ± SE. * Hyper-85 rates significantly different from the rates of normoxic lungs at the same infused DQH2 concentrations. # Hyper-60 rates significantly different from the rates of normoxic lungs at the same infused DQH2 concentrations.
Figure 2A: The relationship between the steady state rate of DQH2 efflux and the infused DQ concentrations during DQ arterial infusion, for normoxic lungs (n = 4), hyper-85 lungs (n = 5) and hyper-60 lungs ( n=5)
Figure 2B: The relationship between the steady state rate of DQH2 efflux and the infused DQ concentrations during DQ arterial infusion in the presence of AA (10 uM), for normoxic lungs (n = 5), hyper-85 lungs (n = 5) and hyper-60 lungs (n=4).
Figure 2C: The relationship between the steady state rate of DQ efflux and the infused DQH2 concentrations during DQH2 arterial infusion in the presence of Dic (400 uM), for normoxic lungs (n = 6), hyper-85 lungs (n = 6) and hyper-60 lungs (n=5).
Values are mean ± SE. * Hyper-85 rates significantly different from the rates of normoxic lungs at the same infused DQH2 concentrations. # Hyper-60 rates significantly different from the rates of normoxic lungs at the same infused DQH2 concentrations.

Model Assumptions:
Assumptions are quite important preconditions to fit the models to experimental data. An improper assumption may result in the failure of model utilization.
For these perfusion experiments, the assumptions were listed below:
1. The data in Figures 2 are the net result of a) DQ and DQH2 interactions with competing nonlinear tissue redox processes, b) DQ and DQH2 interactions with protein (i.e., BSA) in the vascular space, and c) capillary perfusion kinematics (i.e., a heterogeneous distribution, hc(t), of capillary transit times). Thus, for quantitative interpretation of the data in Figures 2, we utilized a kinetic model that accounts for DQ and DQH2 tissue and vascular interactions as well as the distribution of capillary transit times .
2. The model capillary region consists of parallel non-interacting capillary elements, with different transit times distributed according to hc(t) . The Schematic representation figure in 'perfusion model' section presents a schematic of a single capillary element consisting of a vascular region and its surrounding lung tissue region with volumes Vc (ml) and Ve (ml), respectively. Within the vascular region, DQ and DQH2 participate in nonspecific and rapidly equilibrating interactions with the perfusate albumin (BSA). The free (i.e., not BSA bound) vascular concentrations of DQ and DQH2 can freely permeate (i.e., “flow-limited”) the tissue region from the vascular region. Within the tissue region, DQ is reduced via NQO1, and DQH2 is oxidized via mitochondrial complex III. This reduction and oxidation are assumed to follow Michaelis-Menten kinetics, where Vmax and Km represent the maximum reduction or oxidation rate and Michaelis-Menten constant, respectively. All nonspecific DQ and DQH2 interactions are assumed to follow the law of mass action.
3. The activity of enzyme NQO1 can be inhibited by dicumarol (Dic) . This inhibitory effect can be simulated by setting zero for Vmax of NQO1-mediated DQ reduction. The activity of mitochondrial complex III can be inhibited by antimycin A (AA) . The inhibitory effect of AA can be simulated by setting zero for Vmax of complex III-mediated DQH2 oxidation.
4. The changes on capillary kinetics and capillary perfusion kinematics are represented by the changes on their corresponding parameters. For example, the kinematic parameters such as mean transit time in the capillary kinematics model can be set as variable when fitting the kinematic model to lung bolus infusion experimental data to reflect changes on pulmonary kinematics. Parameters such as Vmax and Km of targeted reduction-oxidation reactions in capillary kinetic model can be set as variables when fitting the kinetic model to lung perfusion experimental data to reflect the changes on pulmonary kinetics. For DQ/DQH2, Vmax1 and Km1a for NQO1-mediated reaction and Vmax2 and Km2a for complex III-mediated reaction are set as variables when fitting kinetic model to experimental data.
5. Rats exposed to 85% O2 for 7 days caused changes on pulmonary kinematics and pulmonary kinetics, and rats exposed to 60% O2 for 7 days caused changes on pulmonary kinetics but not pulmonary kinematics.
This assumption was simply based on the fact that the wet weight and dry weight-wet weight ratio of hyper-60 lungs were not different from those normoxic lungs, but hyper-85 lungs indicated significant changes on lung weight and also lung morphology. Based on this assumption, lung mean transit time for normoxic lungs and hyper-85 lungs were calculated by fitting the kinematic model to their corresponding bolus infusion data (data available in Lung Experiment section). For hyper-60 lungs, its lung mean transit time was set as the value of normoxic lungs.
For kinetic parameters, both Vmax and Km are allowed changes in hyper-85 and hyper-60 lungs. This assumption is based on the observed changes on DQ/DQH2 efflux rate curve for hyper-85 and hyper-60 lungs. Though Km would be an intrinsic property of enzyme, it is known complex III is not a simple protein molecule. Complex III consists of several subunits and works as a complex, the structure of complex III is not as stiff as a protein molecule. Even if a protein, can have several isoforms, which could represent different kinetic properties. Thus, both Vmax and Km were set as variables for model fitting.
Based on above assumptions, the kinematic model was firstly fit to lung bolus infusion data to estimate capillary distribution in normoxic lungs and hyper-85 lungs respectively. The acquired result was set as the capillary distribution parameter in their kinetic model. Lung DQ perfusion along with DQH2+Dicumarol perfusion data contains sufficient information to estimate Vmax1, Km1a for NQO1, Vmax2, Km2a for complex III simutaneously. Therefore, the kinetic model was then fit to lung DQ perfusion data and DQH2+Dicumarol perfusion data in normoxic lungs, hyper-85 lungs respectively. For hyper-60 lungs, the kinetic model was fit to lung DQ and DQH2+Dicumarol perfusion data of hyper-60 with capillary distribution parameter of normoxic lungs.
With the acquired Vmax, Km values as well as capillary distribution values, the kinetic model was then used to predict the unused experimental data, lung DQ+AA perfusion data.
Figure 3 shows the model fitting results and Figure 4 shows the model prediction.
The kinetic values of targeted enzymes were listed in table1.

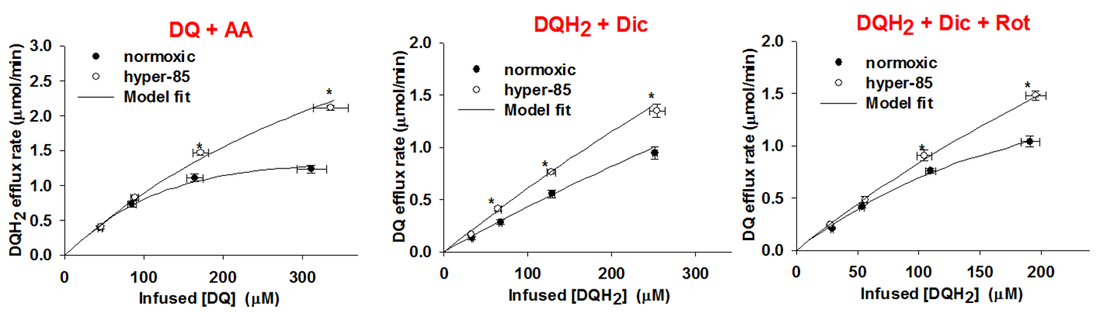
Model Fitting & Prediction
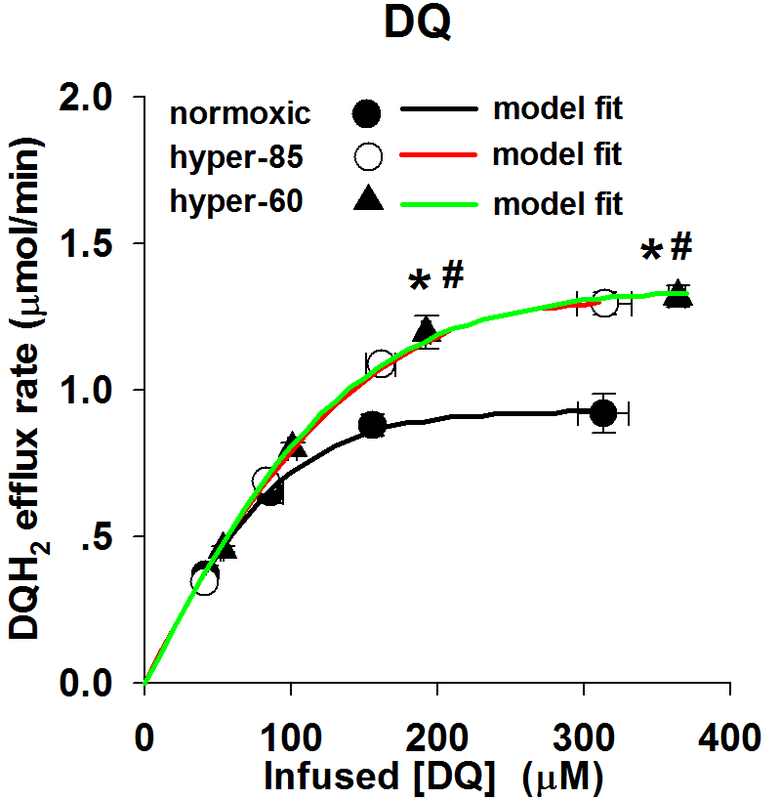
Figure 3. Model Fitting Results
|
|
|
Figure 3A: The model fitting results of DQ perfusion experimental data for normoxic, hyper-85 and hyper-60 lungs, respectively.
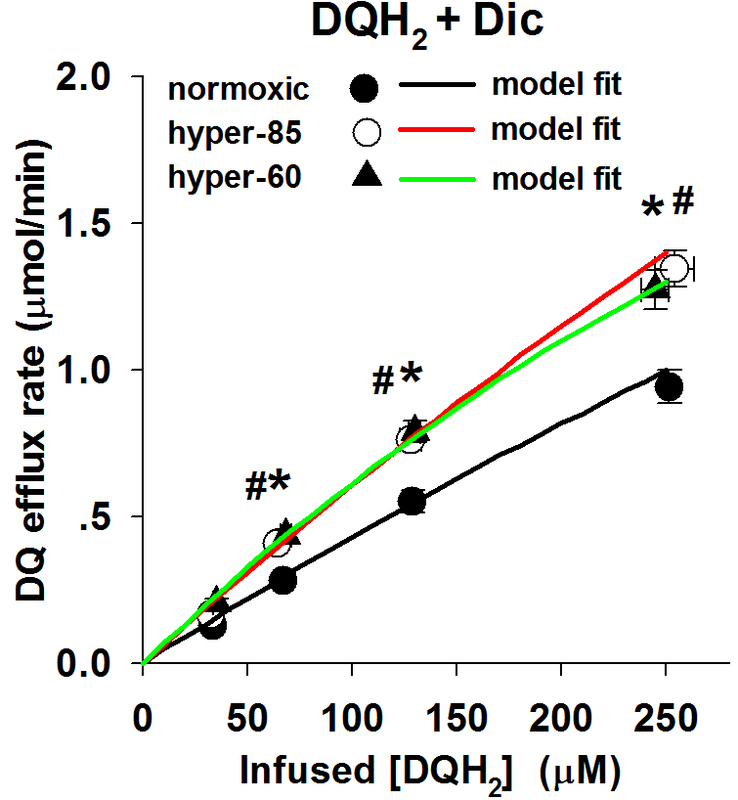
Figure 3B: The model fitting results of DQH2+Dic perfusion experimental data for normoxic, hyper-85 and hyper-60 lungs, respectively.
The experimental data are the mean values with SE.
*: hyper-85 data is significantly different from that of normoxic lungs (P<0.05)
#: hyper-60 data is significantly different from that of normoxic lungs (p<0.05)
These results indicate that the model fits the experimental data perfectly with the kinetic parameters, Vmax and Km, as the variables to be determined.
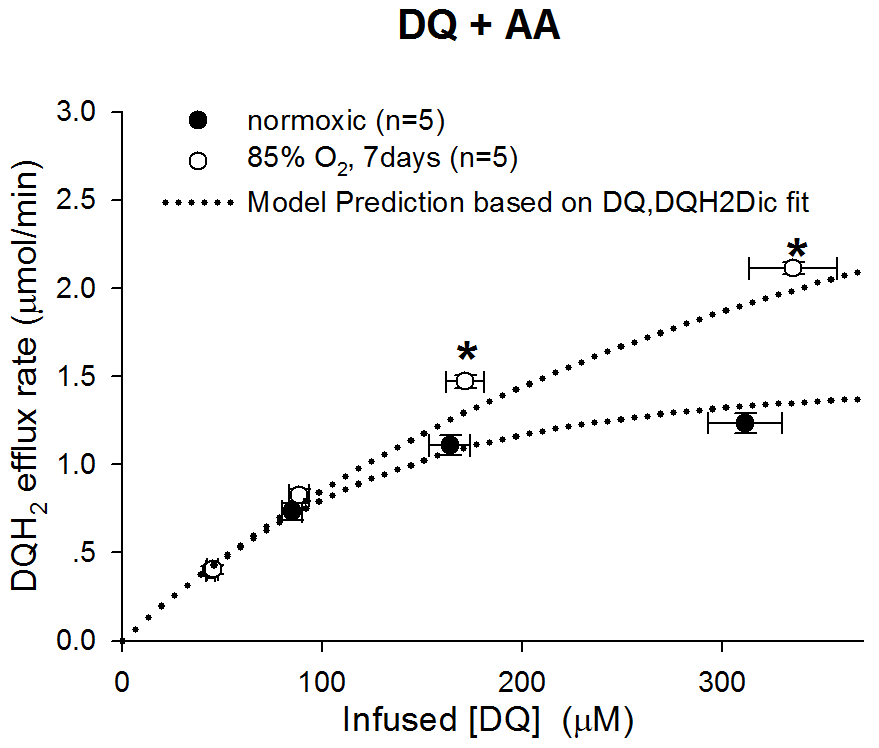
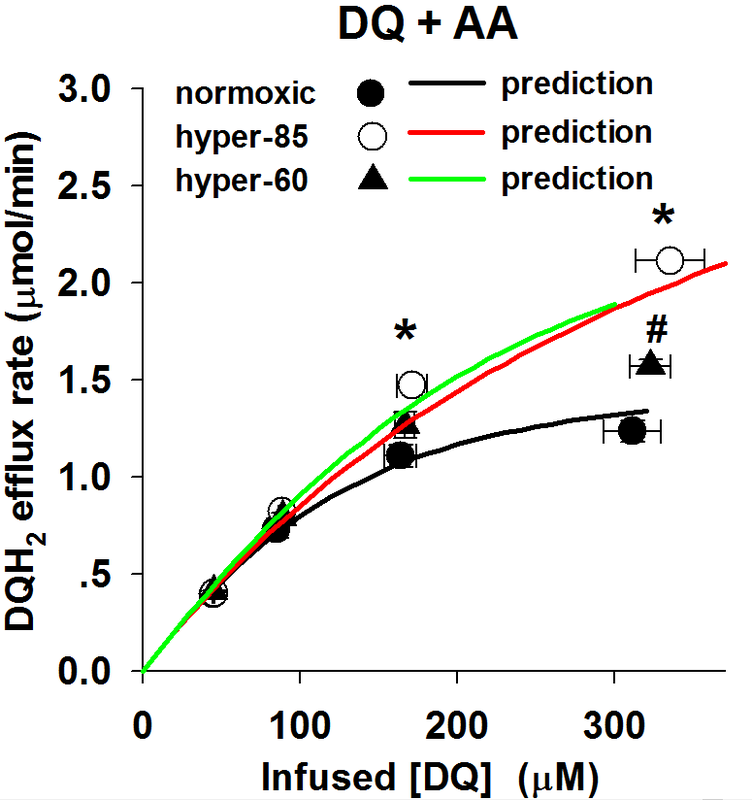
Figure 4. Model Prediction Results
|
The left figure shows that model prediction results for DQ+AA lung perfusion experiments.
The prediction was calculated by the kinetic model with the values of capillary distribution and kinetic parameters estimated by model fitting to experimental data, and Vmax2 as zero to mimic the effect of AA on complex III. The results indicate that the kinematic-kinetic model predicts DQ+AA perfusion data of normoxic rat lungs and hyper-85 lungs successfully.
The prediction of DQ+AA perfusion for hyper-60 lungs didn't work. That's because some assumption for hyper-60 lungs is not true. This is a good example of negative assumption validation. Read the discussion section.
|

Table 1. Kinetic parameters estimated by fitting the model to the mean value of DQ perfusion data and DQH2+Dic perfusion data simultaneously


Discussions
1. The validation of models
The reliability of the model was validated by the prediction of experimental data which was not used for the model fitting. Since the primary oxidase of DQH2 in endothelial cells is complex III and the primary reductase of DQ is NQO1, the experiment set 'DQ perfusion' and 'DQH2+Dic perfusion' contains sufficient information to estimate the activities of both complex III and NQO1. Thus, the DQ perfusion and DQH2 perfusion with NQO1 inhibitor Dicumoral experiments were used to estimate the unknown parameters in the model by fitting the model to the data set. Antimycin A is an inhibitor of mitochondrial complex III, so the experiment DQ+AA is an independent experiment from DQ perfusion and DQH2+Dic perfusion. As what shows in Figure 4, the model along with the parameters estimated by model fitting predicts DQ+AA experimental results for normoxia lungs and hyper-85 lungs successfully.
This prediction of independent experiments validates the model and the assumptions. Any improper in the key factors either of the model or of the assumptions will result in a failure in the prediction.
Since the distribution of capillaries is also required, a series of bolus-injection experiments with membrane-impermeable probes were executed and a kinematic model was established to evaluate the capillary distribution by fitting the kinematic model to experimental data as what showed in Figure 1 step1 and step2. The estimated capillary distribution was a part of the inputs of the perfusion mohdel. Therefore, an improper kinematic estimation could also cause failure in a prediction of the perfusion model.
The perfusion model along with the kinematic model for capillary distribution predicts well not only for normoxic lungs but also for hyper-85 lungs. In previous studies (Ramakrishna M 2011), we have demonstrated that the capillary distribution in hyper-85 lungs is different from that of normoxic lungs. The success in the prediction of DQ+AA experiments for both normoxic lungs and hyper-85 lungs suggests that the successful prediction is not occasional.
It is interesting that hyper-60 lungs failed to predict DQ+AA results (refer to Figure 4). One possible reason could be the wrong assumption of hyper-60's capillary distribution. We estimated the capillary distribution of normoxic lungs and hyper-85 lungs by experiments and corresponding model estimation. However, for hyper-60 lungs, since its dry/wet weight ratio is not different from that of normoxic lungs, it assumed that the capillary distribution of hyper-60 lungs was not different from that of normoxic lungs. Thus, the capillary distribution of normoxic lungs was also taken as the input for hyper-60 lungs. This assumption could be wrong, since firstly, it is not experiment validated; secondly, studies have shown that angiogenesis is quite sensitive to oxidative stress. Rather than this assumption for hyper-60 lungs, the other parts of hyper-60 perfusion model is the same with hyper-85 lungs and normoxic lungs. Thus, the failure in hyper-60 DQ+AA prediction highly suggests a change in capillary distribution in hyper-60 lungs compared with normoxic lungs.
In summary, the lung kinematic-kinetic model was well-validated by prediction of independent experimental data for normoxic lungs and hyper-85 lungs, whose parameters were estimated by fitting kinematic model to bolus injection data and fitting kinetic model to lung perfusion data. The lung kinematic-kinetic model didn't work to predict the independent experiment data of hyper-60 lungs whose kinetic parameters were estimated by fitting the kinetic model to lung perfusion data with kinematic parameters 'borrowed' from the normoxic lungs. In another words, the model predicts that the kinematic parameters, primarily the capillary distribution of hyper-60 lungs, should be changed after mice exposed to 60% O2 for 7 days.
2. The importance of assumptions
Strictly speaking, some assumptions in this study are not parts of the kinematic-kinetic model, for example, the assumption of the effect of mice exposure to 60% O2 for 7 days on capillary distribution. This assumption is not relevant to the model itself, but relevant to the utilization of experimental data. The model itself is independent to this specific study case which was a mouse hyperoxia study . However, since the model need work with experimental data, how you assume the status of relevant parameters of the model for your experiment will have effects on the model fitting and prediction. In another word, even if you built an absolute correct model, if you don't make proper assumptions for your experiments, the model is not supposed to give you the right answer. The improper assumption that mice exposed to 60% O2 for 7 days has no effect on its lung capillary distribution is a negative example. When the model was fit to lung perfusion data of hyper-60 lungs with this assumption, you forced the model to work with something unreal, and hence the model gave you some outputs which were unreal and can't be used to predict the real experimental data.
Similarity, the assumption how hyperoxic exposure affects on the enzyme activities are important for the proper utilization of lung kinetic model. In the previous publication (Z Gan 2011), the assumptions were the hyperoxic exposure changed the enzyme maximum activity (Vmax in M-M equation) but not Km. Thus, the Km was set as the same for all experiments including normoxic lungs, hyper-85 lungs and hyper-60 lungs. The base of this assumption is that the Km is an intrinsic feature of an enzyme and Vmax is an extrinsic property of an enzyme. This kind of assumptions are knowledge based, which means they are limited to the current knowledge, which could be wrong. Unfortunately, if you made a wrong assumption, even if it is based on the current knowledge, the model won't work if the assumption is too far away from the truth.
It is noticeable that mitochondrial complex III is a complex which contains several subunits. Thus, the Km is no longer an intrinsic property. It could be affected by the connections between the subunits, the structure of the subunits or other more complex way. Dr. Semenza et al. demonstrated in cells that hypoxia can induce a switch between subunits of complex IV and hence affect the efficiency of respiratory at complex IV (Semenza 2007, Semenza 2011), namely the Km in M-M equation. As a super-complex, complex III and complex IV work together, the similar thing could occur at complex III when the animal is exposed to chronic oxidative stress. However, the changes on complex III is not experiment-validated. When we try to decide the assumption, what we face is actually a black box. Facing this situation, a better way is to select the more flexible assumption instead of a stringent assumption. A comparison of the results based on different assumptions could also make some senses. In this hyperoxic study, if we set Vmax as a variable among lung groups and fix the value of Km among lung groups, we got the results available in Z Gan 2011, which can't predict other independent experimental data. If we set both Vmax and Km as variables among lung groups, we got above results which can predict independent experimental data. This suggests that the assumption that both Vmax and Km of complex III can change in mice exposed to hyperoxia for 7 days is fit to the truth.
In summary, not only the model itself but also the way how to utilize and interpret your experiments is important to the success of the simulation of a biological system. In this study, the assumption that chronic hyperoxic exposure can change both Vmax and Km of complex III lead to the success of model prediction for independent experiments, and hence point out the situation which is closer to the truth.
3. The biological significance of the results
. complex III's
2. NQO1's
3. hyper-60'sbiological meaning