

Probes
2,3,5,6-tetramethyl-1,4-benzoquinone (duroquinone, DQ)
Coenzyme Q1 (CoQ1), the homology of coenzyme Q10
DQ and CoQ1 are redox active compounds that have been used to probe pulmonary endothelial surface and the activity of intracellular redox enzymes due to their high water and lipid solubility, as well as their flow-limited character, availability and ability to be substrates of one or more of the targeted enzymes. Previous studies demonstrated that NQO1 plays a dominant role in DQ reduction on a single passage through the rat pulmonary circulation and complex III is the dominant enzyme mediating the oxidation of DQH2. A NQO1 contribution to CoQ1 reduction has been identified and the protective effect of CoQ1 in complex I dysfunction has been attributed to non NQO1-mediated CoQ1 reduction followed by CoQ1H2 oxidation at complex III. The figure below shows the enzyme-mediated DQ, CoQ1 reactions and the responding inhibitors of the enzymes which indicates in red.

Inhibitors
Rotenone (Rot): depress the activity of mitochondrial complex I.
Antimycin A (AA): depress the activity of mitochondrial complex III. Experiments show that AA can inhibit complex III activity completely.
Dicumoral (Dic): inhibit the activity of NQO1. Publications indicate that dicumarol is not a NQO1 specific inhibitor. Dicumarol also inhibits other enzymes. Hence, a high concentration is required to inhibit NQO1 by dicumoral.

Experimental Animal and Lungs
Intact lungs preserves lung structure, lung hemodynamics as welll as the cellular enzymatic environment, hence is selected as the experimental material.
Briefly, the intact rat lungs were isolated from anesthetized SD male rats (~250 g) with cannula via the pulmonary artery, the trachea. The pulmonary venous outflow was accessed via a cannula in the left atrium. The lung was then removed from the chest and attached to a ventilation and perfusion system as showed in Figure below. More details are available here. Dissertation @ Marquette
Briefly, the intact rat lungs were isolated from anesthetized SD male rats (~250 g) with cannula via the pulmonary artery, the trachea. The pulmonary venous outflow was accessed via a cannula in the left atrium. The lung was then removed from the chest and attached to a ventilation and perfusion system as showed in Figure below. More details are available here. Dissertation @ Marquette

Protocol of Hyperoxic Exposure
For normoxic lung studies, male Sprague-Dawley rats (275 to 325 g; Charles River) were exposed to room air. For the hyperoxic lung studies, age matched rats were housed in a Plexiglas chamber (13W x 23L x 12H inches) maintained at ~ 85% O2 (hyper-85) or ~60% O2 (hyper-60), balance N2, for 7 days with free access to food and water. The total gas flow was 3.5 liters/min, and the chamber CO2 was maintained at < 0.5 %. The temperature within the chamber was maintained at 20-22oC using a custom built cooling system. The chamber was opened every other day for 15 min to weigh the animals, place them in a clean cage, and replace food, water, and CO2 absorbent.
Protocol of Intact Lung Isolation
Rats were anesthetized with pentobarbital sodium (40 mg/kg body wt. i.p.), the trachea was then clamped, the chest was opened and heparin (0.7 IU/g body wt.) was injected into the right ventricle (Audi et al., 2008). A 1 ml blood sample was collected for measurement of aortic blood hematocrit. The pulmonary artery and the trachea were then cannulated, and the pulmonary venous outflow was accessed via a cannula in the left atrium. The lung was then removed from the chest and attached to a ventilation and perfusion system.
At the end of pulse infusion experiments described below, the lung was removed and weighed to obtain lung wet weight. The lung was then dried and weighed again to obtain dry weight and wet/dry weight ratio.

Lung Bolus Infusion Experiment

Lung Perfusion Experiment
General: Perfusate, lung Perfusion-ventilation and Sample Collection
Control perfusate: 4.7 mM KCl, 2.51 mM CaCl2, 1.19 mM MgSO4, 2.5 mM KH2PO4, 118 mM NaCl, 25 mM NaHCO3, 5.5 mM glucose, and 5% fatty-acid free bovine serum albumin (BSA). The perfusate was equilibrated with 15% O2, 6% CO2, balance N2 resulting in perfusate PO2, PCO2 and pH of ~105 Torr, 40 Torr, and 7.4, respectively.
Perfusion-ventilation system: The single pass perfusion system was primed (Masterflex roller pump) with the control perfusate maintained at 37 degree. Control perfusate was pumped through the system and driven the system air free. After the lung was isolated and attached to the system, the lung was then washed by control perfusate until the lung was evenly balanced and venous effluent was free of blood. The lung was ventilated (40 breaths/min) with end-inspiratory and end-expiratory pressures of ~ 6 and 3 mmHg, respectively, with 5% O2, 6% CO2, balanced by N2. The pulmonary arterial pressure was referenced to atmospheric pressure at the level of the left atrium and monitored continuously during the course of the experiments. The venous effluent pressure was atmospheric pressure.
Venous Samples: A 1 ml venous effluent sample was collected at the end of each pulse infusion. The collected venous effluent samples were centrifuged (13,500 g) for 1 min. For each sample, 100 μl of the resulting supernatant was added into a micro tube containing 0.8 ml ice-cold ethanol and 10 μl potassium ferricyanide (12.1 mM in water) which oxidized hydroduroquinone to quinone or 10 μ1 EDTA (1 mM in water) to minimize auto-oxidation of hydroquinone. The tubes were mixed on a vortex mixer followed by centrifugation at 13,500 g for 7 min. A perfusate sample that had passed through the lungs but contained no probe was treated in the same way to be used as the blank for absorbance measurements. The absorbance values were measured at 275 nm for CoQ1 or CoQ1H2 and 265 nm for DQ or DQH2 using a spectrophotometer. Sample concentrations of probes (in μM) were then calculated from the absorbance values of the fully oxidized (abs1) and EDTA-treated supernatant (abs2) using the equations below.

Pre-experiments
The Determination of Perfusion Time: The perfusion time was determined by the required time for the steady state. As showed in Figure 1, the concentration of DQ in pulmonary venous effluent reached around steady state when the lung was perfused for 120 seconds. Since the activities of lung redox enzymes are analyzed based on the reactions under steady state, therefore, the effluent samples shall be collected when the probe reactions in perfused lung reaches steady state. Thus, 135-second perfusion was selected for DQ perfusion experiment.
A lot of factors impact the required time for steady state, such as the membrane permeability of probes, the involved reactions. For probe CoQ1, it reaches steady state much quicker, based on the experimental results, 45 second perfusion was selected for CoQ1 perfusion experiment.
The Determination of Probe Concentrations: We assume that biochemical reactions of quinone probes can be described by Michaelis-Menten equation. The combination of multiple M-M reactions gives a combined M-M output. Thus, the probe concentration in pulmonary venous effluent is supposed to have a steady state concentration and a Km-like value. Thus, we need multiple steady-state concentrations to estimate the Km value and the Vmax for M-M reactions.
Figure 2. A shows that DQH2 concentration in venous effluent during DQ perfusion didn't change a lot when DQ infusion concentration is bigger than 200 uM. Thus, 50, 100, 200 and 400 uM were selected as the perfusion concentrations of DQ.
Figure 3. A shows that CoQ1H2 concentration in venous effluent during CoQ1 perfusion didn't change a lot when CoQ1 infusion concentration is larger than 200 uM. Since more enzymes were involved in CoQ1 metabolism, hence CoQ1 indicates a higher sensitivity. Thus, 25, 50, 100, 200 and 400 uM were selected as the perfusion concentrations of CoQ1.
The Determination of Flow Rate: The flow rate when the perfusion containing quinone probe passes through pulmonary capillaries can impact the the percentage of probe that diffuse into the cells. A high flow rate results in a small percentage of utilized probe, while a low flow rate results in a fully utilization of probe and hence a small dynamic range. The flow rate in these experiments was determined by the maximum of the dynamic range when the activities of targeted enzymes were decreased by the application of inhibitors. For DQ perfusion experiments, the flow rate was 10 ml/min. For CoQ1 perfusion experiments, the flow rate was 30 ml/min.
Protocol for Determination of Perfused Capillary Surface Area
A permeability-surface area product (PS, ml/min) is considered to be an index of perfused capillary endothelial surface area in intact rat lungs. N-[3-(2-Furyl) acryloyl]-Phe-Gly-Gly (FAPGG) is used to evaluate the rate constant of ACE-mediated FAPGG hydrolysis as an index of perfused capillary surface area since the activity of ACE on a unit capillary surface area is stable. PS represented by the linear steady state rate of ACE-mediated FAPGG hydrolysis passage through a perfused lung during FAPGG perfusion is defined by the equation below:
PS = -F ln(1-E)
F is the flow rate. In this study, the flow rate was 30 ml/min for FAPGG. E is the steady-state extraction rate of FAPGG, E=1.5*(abs1-abs2)/abs1, where abs1 is the absorbance value of FAPGG sample before the hydrolysis reaction, abs2 is the absorbance value of FAPGG sample after the hydrolysis reaction.
Protocol of Ubiquinone Perfusion Experiment
DQ/DQH2: To determine the DQ reduction/DQH2 oxidation capacity of the lung, four 135-second long sequential arterial pulse infusions at DQ concentrations of 50, 100, 200, and 400 mM were carried out with a perfusate flow of 10 ml/min. For each pulse infusion, a 1 ml venous effluent sample (1 ml) was collected between 130 ~ 135 seconds after the initiation of the pulse infusion. Between pulse infusions, the lung was perfused with 30 ml of fresh perfusate to wash the lung and perfusion system of any remaining traces of DQ and/or DQH2.
CoQ1/CoQ1H2: To determine the CoQ1 reduction/CoQ1H2 oxidation capacity of the lung, five 45-second long sequential arterial pulse infusions at CoQ1 concentrations of 25, 50, 100, 200, and 400 mM were carried out with a perfusate flow of 30 ml/min. For each pulse infusion, a 1 ml venous effluent sample (1 ml) was collected between 42 ~ 45 seconds after the initiation of the pulse infusion. Between pulse infusions, the lung was perfused with 30 ml of fresh perfusate to wash the lung and perfusion system of any remaining traces of CoQ1 and/or CoQ1H2.
Protocol of Perfusion Experiment with Inhibitors
The Determination of Inhibitor Concentrations: The concentrations of inhibitors were initially selected based on publications and then determined by inhibitor experiments. The smallest concentration of inhibitor which results in a maximum inhibition of corresponding enzyme activity was selected as the utilized concentration.
Rotenone (Rot): 20 uM
Antimycin A (AA): 10 uM
Dicumoral (Dic): 400 uM
Perfusions with Inhibitor(s):
AA + DQ: To determine the capacity of NQO1-mediated DQ reduction, each lung was perfused for 5 min with perfusate containing antimycin A (AA, 10 mM, complex III inhibitor) to inhibit complex III mediated DQH2 oxidation (Boveris, Oshino & Erecinska, 1971). This was followed by four successive DQ pulse infusions at a flow of 10 ml/min, with the inhibitor present throughout the infusion protocol.
Dic + DQH2: To determine the capacity of complex III-mediated DQH2 oxidation, each lung was perfused for 5 min with perfusate containing dicumarol (Dic, 400 uM, NQO1 inhibitor) to inhibit NQO1 mediated DQ reduction. This was followed by four successive DQH2 pulse infusions at a flow of 10 ml/min, with the inhibitor present throughout the infusion protocol.
AA + CoQ1: To determine CoQ1 total lung reduction capacity, the lung was perfused for 5 min with perfusate containing AA inhibit complex III mediated CoQ1H2 oxidation. This was followed by five 45-second sequential arterial pulse infusions at CoQ1 concentrations of 25, 50, 100, 200, and 400 uM at a flow of 30 ml/min, with the inhibitor present throughout the infusion protocol.
Dic + CoQ1: To identify the role of NQO1 on CoQ1 reduction, each lung was perfused for 5 min with perfusate containing dicumarol (Dic, 400 uM, NQO1 inhibitor) to inhibit NQO1 mediated CoQ1 reduction. This was followed by five sequential arterial pulse infusions at CoQ1 concentrations of 25, 50, 100, 200, and 400 uM at a flow of 30 ml/min, with the inhibitor present throughout the infusion protocol.
Rot + CoQ1: To identify the role of complex I on CoQ1 reduction, each lung was perfused for 5 min with perfusate containing rotenone (Rot, 20 uM, complex I inhibitor) to inhibit complex I mediated CoQ1 reduction. This was followed by five sequential arterial pulse infusions at CoQ1 concentrations of 25, 50, 100, 200, and 400 uM at a flow of 30 ml/min, with the inhibitor present throughout the infusion protocol.
Dic+Rot+CoQ1: To estimate the capacity of CoQ1 reduction rather than complex I and NQO1, each lung was perfused for 5 min with CoQ1 perfusate containing dicumarol ( 400 uM ) plus rotenone ( 20 uM). This was followed by five sequential arterial pulse infusions at CoQ1 concentrations of 25, 50, 100, 200, and 400 uM at a flow of 30 ml/min, with the inhibitors present throughout the infusion protocol.
Dic+Rot+CoQ1H2: To evaluate the capacity of complex III mediated CoQ1H2 oxidation on passage through the pulmonary circulation, each lung was perfused for 5 min with CoQ1H2 perfusate containing dicumarol ( 400 uM ) plus rotenone ( 20 uM). This was followed by five sequential arterial pulse infusions at CoQ1H2 concentrations of 25, 50, 100, 200, and 400 uM at a flow of 30 ml/min, with the inhibitors present throughout the infusion protocol.
Dic+CoQ1H2: To estimate the effect of electron transport chain on CoQ1-CoQ1H2 metabolism, each lung was perfused for 5 min with CoQ1H2 perfusate containing dicumarol ( 400 uM ). This was followed by five sequential arterial pulse infusions at CoQ1H2 concentrations of 25, 50, 100, 200, and 400 uM at a flow of 30 ml/min, with the inhibitor present throughout the infusion protocol.

Result Examples
Results for Intact Perfused Lungs From Rats Exposed to Room Air or 85% Oxygen for 7 days
Figure 1. Pre-experiment of DQ perfusion

|
|
Time course of DQ/DQH2
concentration in the venous effluent during 100 µM DQ infusion experiment
passage through an intact rat lung. The DQ/DQH2 in venous effluent is close to the steady state after 120 seconds' infusion.
|
|
Figure 2. DQ perfusion experiments

|

|

|
Figures from the left to the right
A: The relationship between the steady state rate of DQH2 efflux and the infused DQ concentrations during DQ arterial infusion, for normoxic lungs (n = 4), hyper-85 lungs (n = 5)
B: The relationship between the steady state rate of DQH2 efflux and the infused DQ concentrations during DQ arterial infusion in the presence of AA (10 uM), for normoxic lungs (n = 5), hyper-85 lungs (n = 5).
C: The relationship between the steady state rate of DQ efflux and the infused DQH2 concentrations during DQH2 arterial infusion in the presence of Dic (400 uM), for normoxic lungs (n = 6), hyper-85 lungs (n = 6)
Values are mean ± SE. * Hyper-85 rates significantly different from the rates of normoxic lungs at the same infused DQH2 concentrations.
Hyper-85: lungs from SD rats exposed to 85% O2 for 7 days
Figure 3. CoQ1 perfusion experiments

|

|
|
|
|

|
Figures from the left to the right
A: The relationship between the steady state rate of CoQ1H2 efflux and the infused CoQ1 concentrations during CoQ1 arterial infusion for normoxic lungs (n = 7), hyper-85 lungs (n = 11).
B: The relationship between the steady state rate of CoQ1H2 efflux and the infused CoQ1 concentrations during CoQ1 arterial infusion in the presence of rotenone (Rot, 20 uM), for normoxic lungs (n = 5), hyper-85 lungs (n = 8).
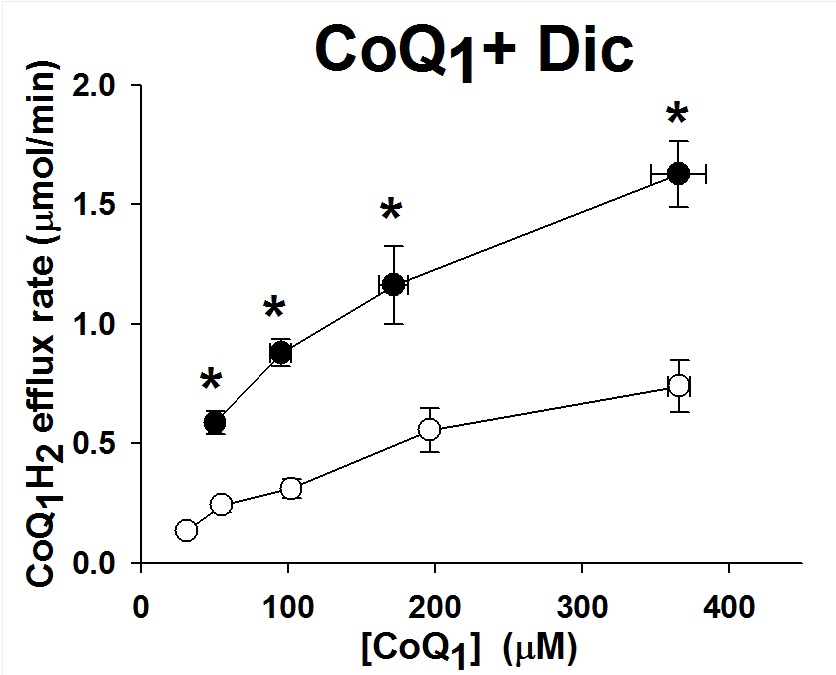
C: The relationship between the steady state rate of CoQ1H2 efflux and the infused CoQ1 concentrations during CoQ1 arterial infusion in the presence of dicumarol (Dic, 400 uM), for normoxic lungs (n = 4), hyper-85 lungs (n = 4).
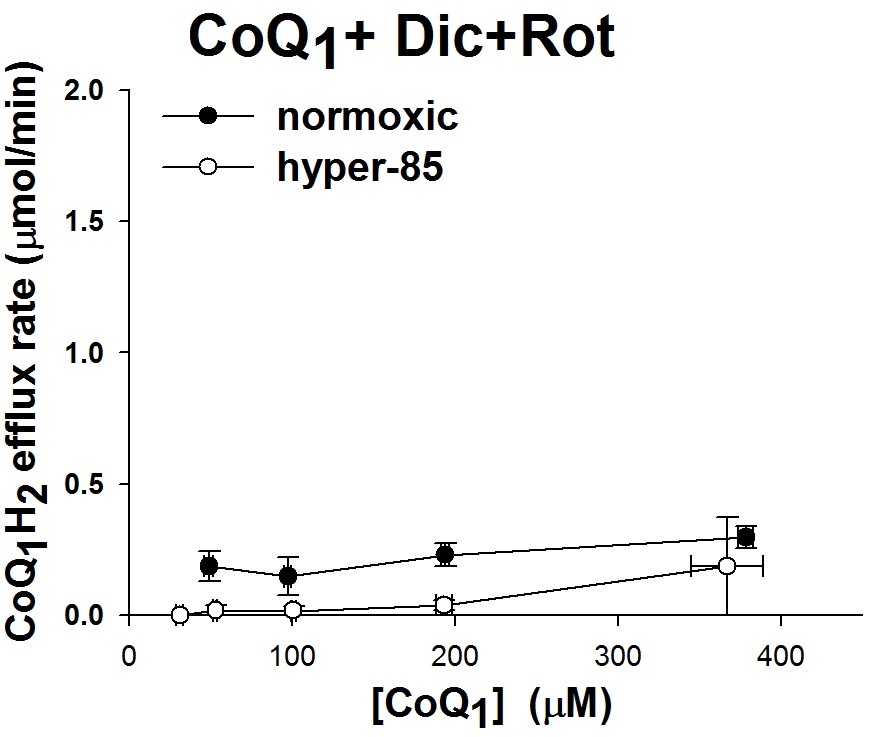
D: The relationship between the steady state rate of CoQ1H2 efflux and the infused CoQ1 concentrations during CoQ1 arterial infusion in the presence of dicumarol (Dic, 400 uM) and rotenone (Rot, 20 uM), for normoxic lungs (n = 4), hyper-85 lungs (n = 3).
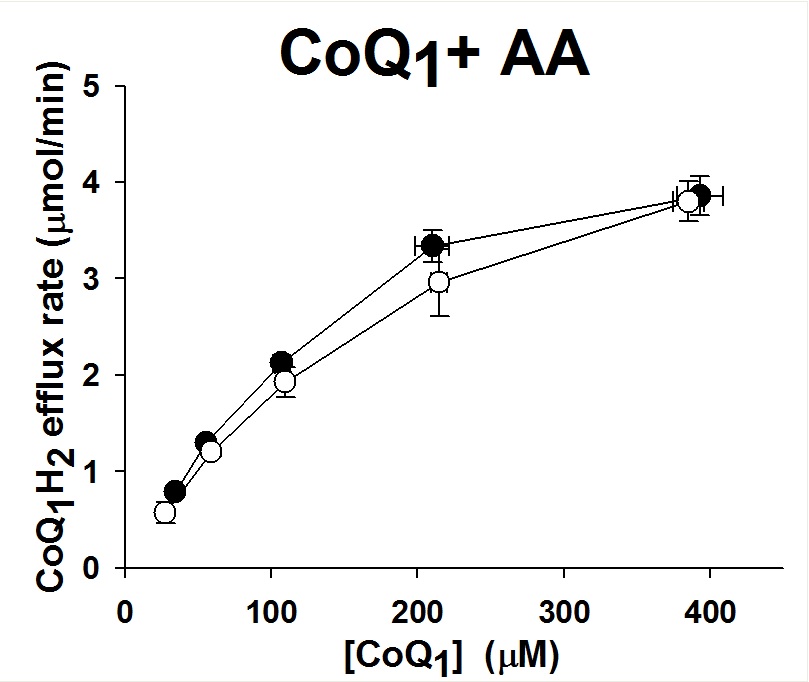
E: The relationship between the steady state rate CoQ1H2 efflux and the infused CoQ1 concentrations during CoQ1 arterial infusion in the presence of antimycin A (AA, 10 uM) , for normoxic lungs (n = 4), hyper-85 lungs (n = 3).
F: The relationship between the steady state rate of CoQ1 efflux and the infused CoQ1H2 concentrations during CoQ1H2 arterial infusion in the presence of dicumarol (Dic, 400 uM) and rotenone (Rot, 20 uM), for normoxic lungs (n = 6), hyper-85 lungs (n = 4).
Values are mean ± SE. * Hyper-85 rates significantly different from the rates of normoxic lungs at the same infused CoQ1 concentrations.
A: The relationship between the steady state rate of CoQ1H2 efflux and the infused CoQ1 concentrations during CoQ1 arterial infusion for normoxic lungs (n = 7), hyper-85 lungs (n = 11).
B: The relationship between the steady state rate of CoQ1H2 efflux and the infused CoQ1 concentrations during CoQ1 arterial infusion in the presence of rotenone (Rot, 20 uM), for normoxic lungs (n = 5), hyper-85 lungs (n = 8).
C: The relationship between the steady state rate of CoQ1H2 efflux and the infused CoQ1 concentrations during CoQ1 arterial infusion in the presence of dicumarol (Dic, 400 uM), for normoxic lungs (n = 4), hyper-85 lungs (n = 4).
D: The relationship between the steady state rate of CoQ1H2 efflux and the infused CoQ1 concentrations during CoQ1 arterial infusion in the presence of dicumarol (Dic, 400 uM) and rotenone (Rot, 20 uM), for normoxic lungs (n = 4), hyper-85 lungs (n = 3).
E: The relationship between the steady state rate CoQ1H2 efflux and the infused CoQ1 concentrations during CoQ1 arterial infusion in the presence of antimycin A (AA, 10 uM) , for normoxic lungs (n = 4), hyper-85 lungs (n = 3).
F: The relationship between the steady state rate of CoQ1 efflux and the infused CoQ1H2 concentrations during CoQ1H2 arterial infusion in the presence of dicumarol (Dic, 400 uM) and rotenone (Rot, 20 uM), for normoxic lungs (n = 6), hyper-85 lungs (n = 4).
Values are mean ± SE. * Hyper-85 rates significantly different from the rates of normoxic lungs at the same infused CoQ1 concentrations.
Figure 4. Bolus infusion experiments to estimate pulmonary kinematics
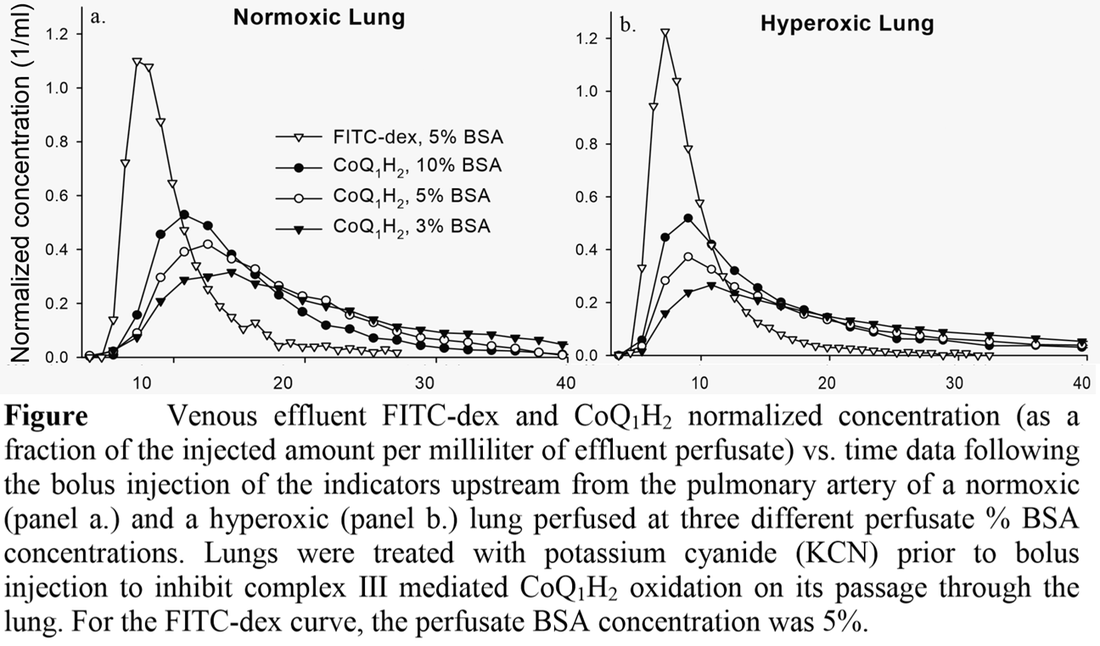
Note: hyperoxic lungs were lungs from rats exposed to 85% O2 for 7 days.

References
Quantitative evaluation of redox processes in intact rat lungs and endothelial cells and the effect of hyperoxia
Gan Z
Disseration @ Marquette University, 2011
Quantifying mitochondrial and plasma membrane potentials in intact pulmonary arterial endothelial cells based on extracellular disposition of rhodamine dyes
Gan Z, Audi SH, Bongard RD, Gauthier KM and Merker MP
Am J Physiol Lung Cell Mol Physiol. 2011, 300(5):L762-72
Distribution of capillary transit times in isolated lungs of oxygen-tolerant rats
Ramakrishna M, Gan Z, Clough AV, Molthen RC, Roerig DL and Audi SH
Annals of biomedical engineering. 2010, 38(11):3449-65.
Coenzyme Q1 redox metabolism during passage through the rat pulmonary circulation and the effect of hyperoxia
Audi SH, Merker MP, Krenz GS, Ahuja T, Roerig DL and Bongard RD.
J Appl Physiol, 2008; 105: 1114-1126
Effect of chronic hyperoxic exposure on duroquinone reduction in adult rat lungs
Audi SH, Bongard RD, Krenz GS, Rickaby DA, Haworth ST, Eisenhauer J, Roerig DL and Merker MP.
Am J Physiol Lung Cell Mol Physiol. 2005; 289: L788-L797
