

|
A schematic representation of lung kinetic model
Basically, capillaries are the primary sites where biochemical reactions are conducted. The distribution of chemicals and biochemical reactions in single capillary are described by a kinetic model. The distribution of capillaries in an intact lung is described by a capillary transit time model. The chemical distribution and total biochemical reactions in an intact lung are then simulated by combining the kinetic model for single capillary and the capillary distribution model in an intact lung. The whole lung model is then fitted to experimental data to estimate the activities of targeted enzymes. |

|

|
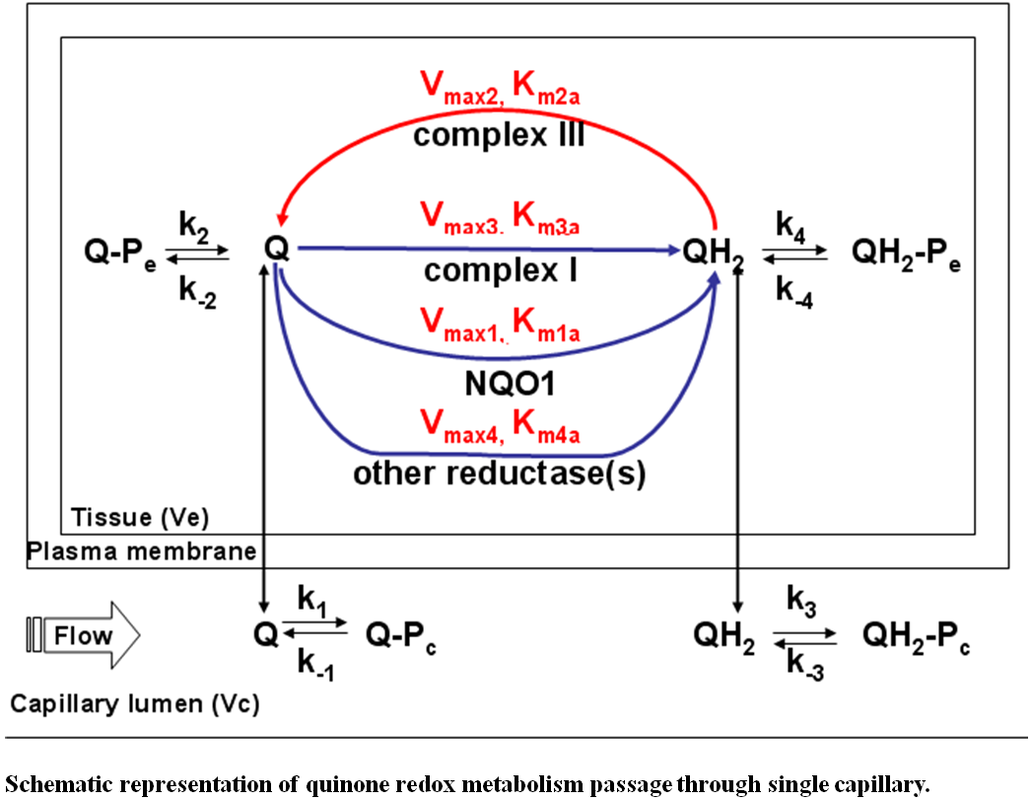
Schematic representation of quinone redox metabolism passage through single capillary.
Vmax1, Vmax2, Vmax3 and Vmax4 are the respective maximum rates for quinone reduction via NQO1, hydroquinone oxidation via complex III, quinine reduction via complex I and quinine reduction via other reductases. Km1a, Km2a, Km3a and Km4a are the apparent Michaelis-Menten constants for NQO1, complex III, complex I and other reductases. Q, Q-Pe, and Q-Pc represented free, albumin-bound and tissue protein-bound quinone respectively. QH2, QH2-Pe, and QH2-Pc represented free, albumin-bound and tissue protein-bound hydroquinone respectively. k1, k2, k3 and k4 were bound rate constants for the interactions of Q-BSA, Q-tissue protein, QH2-BSA and QH2-tissue protein. k-1, k-2, k-3 and k-4 were bound rate constants for the interactions of Q-BSA, Q-tissue protein, QH2-BSA and QH2-tissue protein. |
Based on the single capillary element model, the species balance equations descriptive of spatial and temporal variations in the concentrations of Q and QH2 in the vascular volume (Vc) and tissue volume (Ve) are

where W = convective transport velocity = L/ ; x = 0 and x = L are the capillary inlet and outlet, respectively; is the capillary mean transit time; Q(x,t), and QH2(x,t) are vascular concentrations of free quinone (Q) and hydroquinone (QH2) forms, respectively, at distance x from the capillary inlet at time t; = a1 Q and = a3 QH2 are the total (free + BSA bound) vascular concentrations of Q and QH2, respectively; a1 = 1 + (Q bound fraction/ Q free fraction) and a3 = 1 + (QH2 bound fraction/ QH2 free fraction) are constants which account for the rapidly equilibrating interactions of Q and QH2 with the 5% BSA perfusate calculated from the fractions of Q and QH2 bound to BSA obtained by ultrafiltration. Vmax1, Vmax2, Vmax3 and Vmax4 are the respective maximum rates of quinone reduction via NQO1, hydroquinone oxidation via complex III, quinone reduction via complex I and quinone reduction via other reductase(s). Km1a, Km2a, Km3a and Km4a are the respective apparent Michaelis-Menten constants for quinone reduction via NQO1, hydroquinone oxidation via complex III, quinone reduction via complex I and quinone reduction via other reductase(s). VF1 = (a2 /a1) Ve and VF2 = (a4 /a3) Ve are the respective virtual volumes of the distributions for Q and QH2, where a2 and a4 are the constants which account for the rapidly equilibrating interactions of Q and QH2 with lung tissue sites (Pe) of association, respectively.
For DQ and DQH2, a1 =25 and a3=4. For CoQ1 and CoQ1H2, a1 =14.6, and a3=16.5 (Audi et al., 2005, 2008). These values were determined by centrifugal ultrafiltration.
For DQ and DQH2, a1 =25 and a3=4. For CoQ1 and CoQ1H2, a1 =14.6, and a3=16.5 (Audi et al., 2005, 2008). These values were determined by centrifugal ultrafiltration.


|
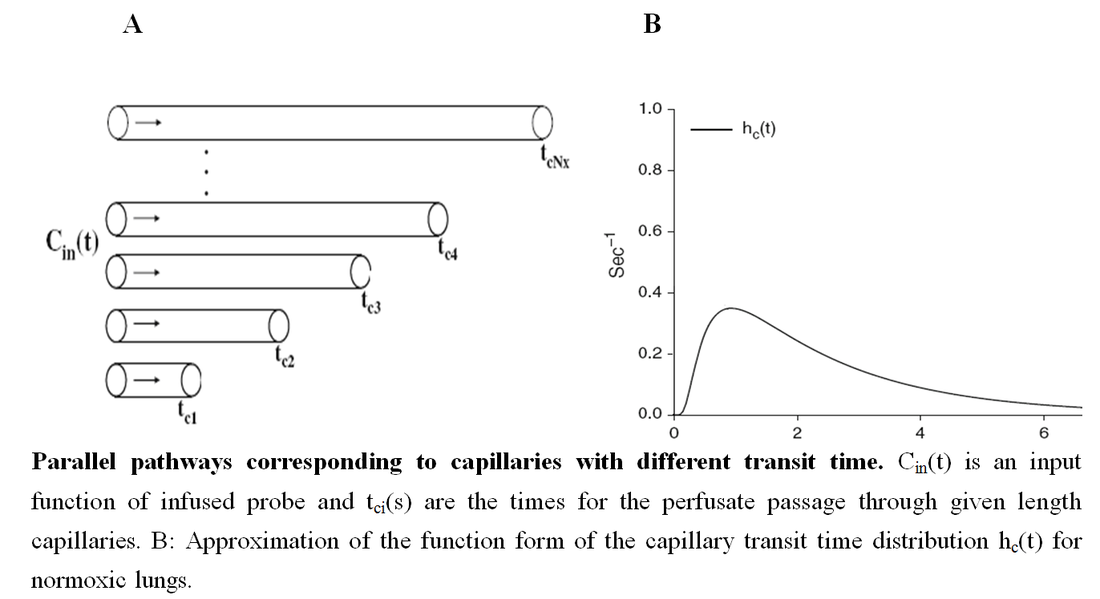
For the lung model, the effect of the distribution of capillary transit time (hc(t)) on the plasma concentrations and the redox status of Q and QH2 on passage through the pulmonary circulation was taken into consideration. Most of the dispersion within the lung vascular region is due to the capillary bed. Thus, Q and QH2 transit through the arteries and veins are represented by a shifted impulse function, where the shift was the plasma mean transit time through the arteries and veins determined as previously described (Ramakrishna et al., 2010). To provide the whole organ output Q and QH2, the outputs for all transit times were summed, weighted by hc(t).
|

|
gan_fitDQ.m: the main code file to fit DQ model to DQ experimental data.
gan_simDQ.m: the main code file to generate a simulation of DQ/DQH2 perfusion using the assigned parameters. gan_fitCoQ1.m: the main code file to fit CoQ1 model to CoQ1 experimental data gan_simCoQ1.m: the main code file to generate a simulation of CoQ1/CoQ1H2 perfusion using the assigned parameters. data_format.doc: this file describes the required format of input data. | ||||

References:
Quantifying mitochondrial and plasma membrane potentials in intact pulmonary arterial endothelial cells based on extracellular disposition of rhodamine dyes
Gan Z, Audi SH, Bongard RD, Gauthier KM, Merker MP.
Am J Physiol Lung Cell Mol Physiol. 2011 May;300(5):L762-72
Effect of chronic hyperoxic exposure on duroquinone reduction in adult rat lungs
Audi SH, Bongard RD, Krenz GS, Rickaby DA, Haworth ST, Eisenhauer J, Roerig DL and Merker MP.
Am J Physiol Lung Cell Mol Physiol. 2005; 289: L788-L797
Coenzyme Q1 redox metabolism during passage through the rat pulmonary circulation and the effect of hyperoxia.
Audi SH, Merker MP, Krenz GS, Ahuja T, Roerig DL and Bongard RD.
J Appl Physiol, 2008; 105: 1114-1126
